
Solution Overview
The LogicInsight Nutanix Core integration provides comprehensive monitoring for Nutanix Prism Element Clusters, focusing on critical metrics such as storage, CPU, I/O, network performance, and data protection. Designed to ensure optimal cluster performance, this integration helps detect potential issues early, minimizing downtime and preventing critical failures.
It features seven dynamic dashboards offering both high-level overviews and detailed insights, enabling efficient identification of performance bottlenecks or system outages. Key metrics include storage and RAM utilization, CPU load, and protection status—essential for maintaining a stable and efficient Nutanix environment. You can monitor multiple Nutanix clusters simultaneously, ensuring scalability and centralized monitoring across diverse infrastructures.
Additionally, this integration supports Prism Central, enabling the collection of categories and projects as VM tags, which enhances visibility and enables advanced resource calculations directly from the dashboards. The appliance also integrates with IPMI systems, retrieving real-time server health status directly from the hardware, providing deeper insights into physical infrastructure.
Designed for easy adoption, the appliance streamlines setup with minimal configuration effort. This integration includes 10 dashboards and 10 monitors, and supports real-time forwarding of new alerts, tasks, and events to Datadog — improving responsiveness and operational awareness.
Real-Time Insights for Real-World Infrastructure.
This LogicInsight - Cluster Overview dashboard provides a comprehensive visualization of a Nutanix cluster's health, performance, and resource utilization. It is divided into multiple sections to offer insights into different aspects of the infrastructure, making it easier to monitor and troubleshoot potential issues. Below is a detailed explanation of each section:
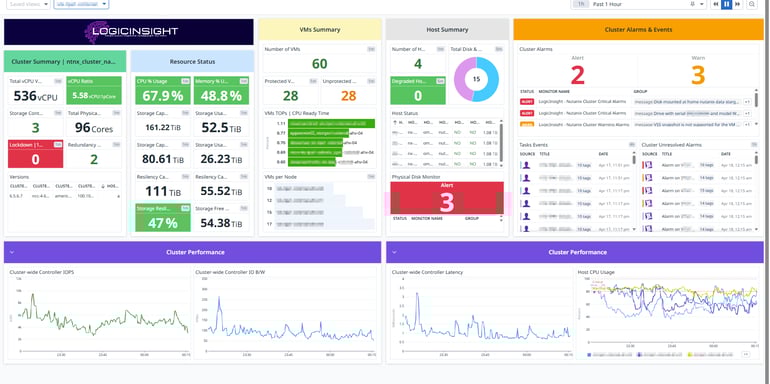
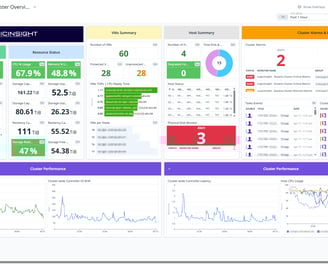
Cluster Overview
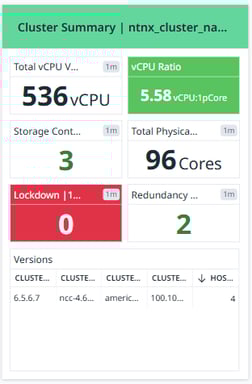
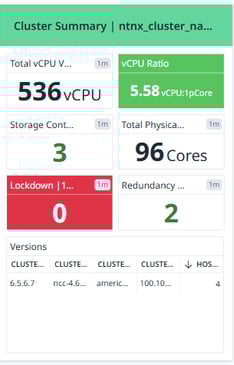
Cluster Summary
This section provides a high-level overview of the cluster, displaying key statistics:
Number of VMs: The total number of virtual machines (VMs) running in the cluster.
vCPU Ratio: The ratio of virtual CPUs (vCPUs) to physical CPU cores, helping to understand CPU allocation efficiency.
Total vCPUs ON: The number of active vCPUs currently running in the environment.
Total Physical Cores: The number of physical CPU cores available in the cluster.
Storage Container Count: The number of storage containers configured in the cluster.
Host Count: The total number of physical hosts in the cluster.
Lockdown State: Indicates if any security lockdown mode is enabled (0 means no lockdown).
Redundancy Factor: Represents the fault tolerance level of the cluster.
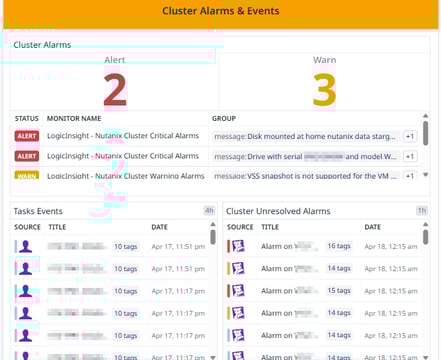
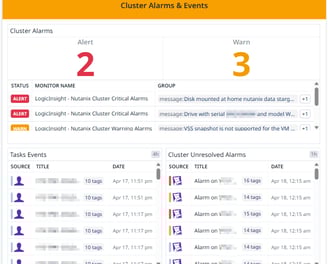
Cluster Alarms & Events (Orange Section - Left Center)
This section monitors issues and alerts related to the cluster:
Cluster Alarms: Displays the number of active warnings and critical alerts affecting the cluster.
Task Events: Shows recent tasks and operations performed in the environment.
Cluster Events: Lists significant system events such as configuration changes, failures, or recovery processes.
This helps admins quickly identify problems and take action before they impact operations.
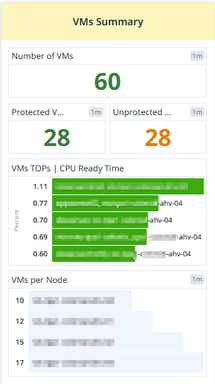
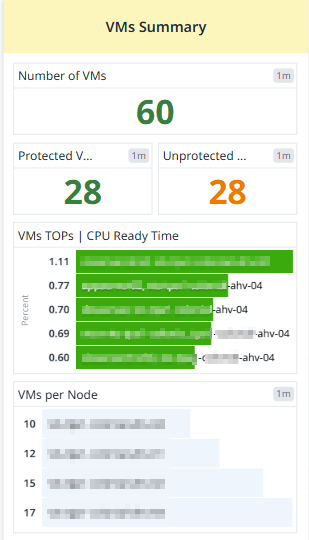
VMs Summary (Yellow Section - Center)
This section focuses on the virtual machines (VMs) running in the cluster:
Protected VMs: Number of VMs that are backed up or replicated.
Unprotected VMs: Number of VMs that are not protected, which may be a risk in case of failure.
VM CPU Ready Time: A visualization of how much time VMs are waiting for CPU resources (high values indicate CPU contention).
VMs per Node: Displays how virtual machines are distributed across different nodes (hosts).
This section is useful for capacity planning and workload balancing.
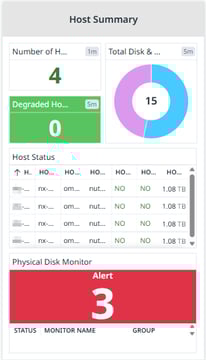

Host Summary (Gray Section - Right Center)
This section provides a detailed view of the physical hosts:
Bad Disks: Number of faulty disks in the cluster (0 means no disk failures).
Degraded Hosts: Number of hosts experiencing issues (0 means all hosts are healthy).
Host Status Table: Displays the status of each host, including health indicators and disk usage.
Total Disk & Types: A pie chart showing the number and type of storage disks (HDD vs. SSD) used in the cluster.
This section helps in identifying hardware failures and ensuring all nodes are functioning properly.
Pricing


Custom
For custom integrations or bundle packages, please contact us at sales@logicinsight.io for tailored pricing options.
Other requirements
Talk with us for ideas or recommendations.
Phisical CPU count
Pricing is based on the total physical CPU core count across all virtual machines running on Prism Element.